What architectural styles define Saint Petersburg's cityscape?
Saint Petersburg showcases a remarkable progression of architectural styles spanning three centuries. The city's dominant styles include Petrine Baroque (1703-1730s), Elizabethan Baroque (1740s-1760s), Neoclassicism (1760s-1840s), Russian Revival (1830s-1917), and Style Moderne (1890s-1917). Each period left distinct landmarks that now form the UNESCO World Heritage designation covering 36 square kilometers of the historic center.
The Petrine Baroque emerged under Peter the Great, characterized by restrained decoration and Dutch influences. Buildings from this era feature simple geometric forms, red brick facades, and white trim. The Summer Palace (1710-1714) on the Fontanka River embodies this early style with its modest two-story structure and regular window placement. The State Hermitage Museum notes that Peter intentionally avoided the ornate Moscow tradition, seeking European rationality instead.
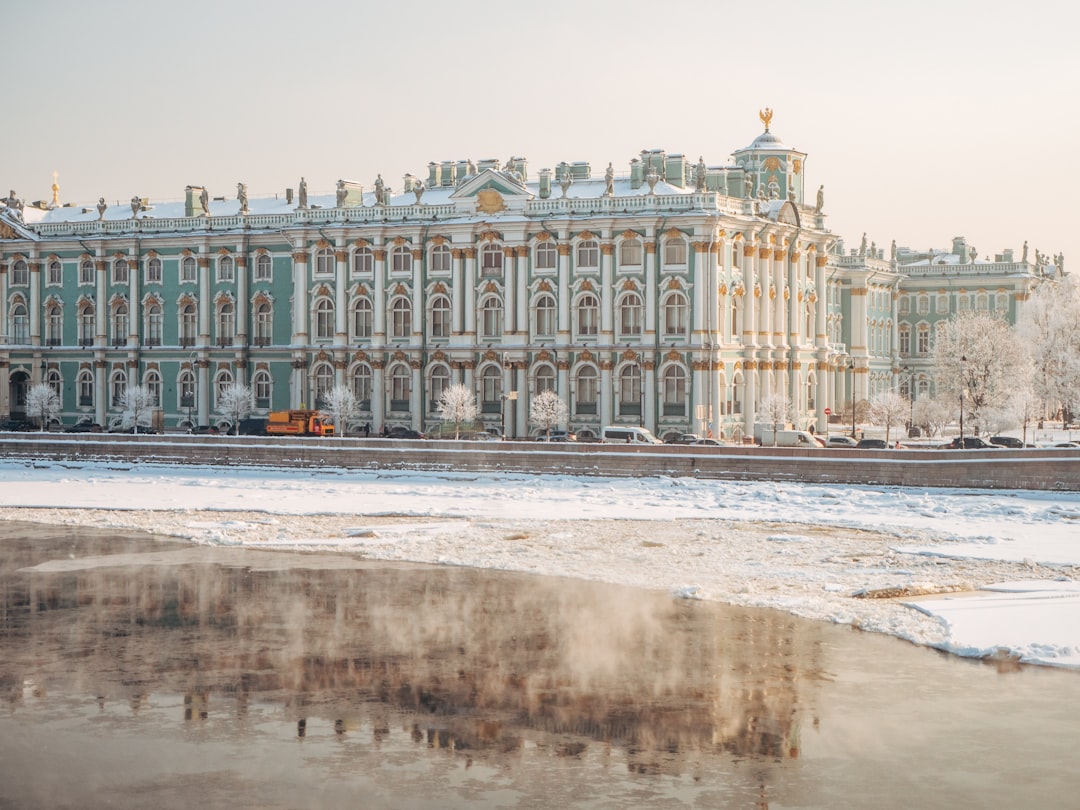
Elizabethan Baroque transformed the city under Empress Elizabeth and architect Bartolomeo Rastrelli. This style exploded with color, gilding, and sculptural excess. The Winter Palace (1754-1762) stretches 250 meters along the Neva River with its turquoise-and-white facade featuring 1,786 doors and 1,945 windows. When I walked from Palace Square toward the Hermitage entrance on my last visit in October 2024, the afternoon light caught the gold leaf on the rooftop statues, creating the theatrical effect Rastrelli intended.
Neoclassicism arrived with Catherine the Great, who favored Greek and Roman restraint. Buildings adopted columned porticos, triangular pediments, and muted yellow or pale green colors. The Admiralty building (1806-1823) by Andrey Zakharov demonstrates this shift with its 407-meter facade, central golden spire, and strict symmetry. The Russian Revival style later emerged as architects like Andrey Stakenschneider incorporated Byzantine and Old Russian elements, visible in the Church of the Savior on Spilled Blood (1883-1907) with its multicolored domes and kokoshnik gables.
Which buildings should architecture enthusiasts prioritize?
Architecture enthusiasts should prioritize the Winter Palace, Kazan Cathedral, Church of the Savior on Spilled Blood, Singer House, and the Admiralty. These five landmarks represent distinct periods and remain accessible within a compact walking area. Combined admission costs approximately €45-60 depending on season, though exterior viewing costs nothing.
The Winter Palace requires at least three hours for both architectural appreciation and the Hermitage collections inside. The main Jordan Staircase, added by Rastrelli, uses white Carrara marble and gilded stucco to create an ascending spectacle. General admission costs 1,000 rubles (approximately €10) when purchased online. The State Hermitage Museum opens 10:30-18:00 Tuesday through Sunday, with Wednesday and Friday extended hours until 21:00.
Kazan Cathedral (1801-1811) by Andrey Voronikhin presents a different architectural challenge. Its 96-column colonnade curves along Nevsky Prospekt, deliberately echoing St. Peter's Basilica in Rome while maintaining Orthodox functionality. The interior dome rises 80 meters, supported by granite columns quarried from Sortavala in Karelia. Entry remains free, though photography inside costs 100 rubles (€1). I noticed during my January 2024 visit that the morning light through the southern windows illuminates the iconostasis particularly well between 11:00-12:00.
The Church of the Savior on Spilled Blood breaks from the prevailing European styles. Built on the assassination site of Alexander II, architect Alfred Parland incorporated 7,500 square meters of mosaics depicting biblical scenes. The exterior uses brick in 20 different patterns, creating a textile-like surface. Tickets cost 350 rubles (€3.50) for adults. The church opens 10:30-18:00 daily except Wednesday, with extended summer hours until 22:30 May through September.
How can visitors navigate a self-guided architectural walking route?
A self-guided architectural route covers 7 kilometers and takes 4-5 hours at a moderate pace with photo stops. Start at Admiralteyskaya metro station (purple line), walk along Nevsky Prospekt to the Fontanka River, return via the Moyka River embankment, and finish at Palace Square. This route passes 23 significant buildings representing all major styles.
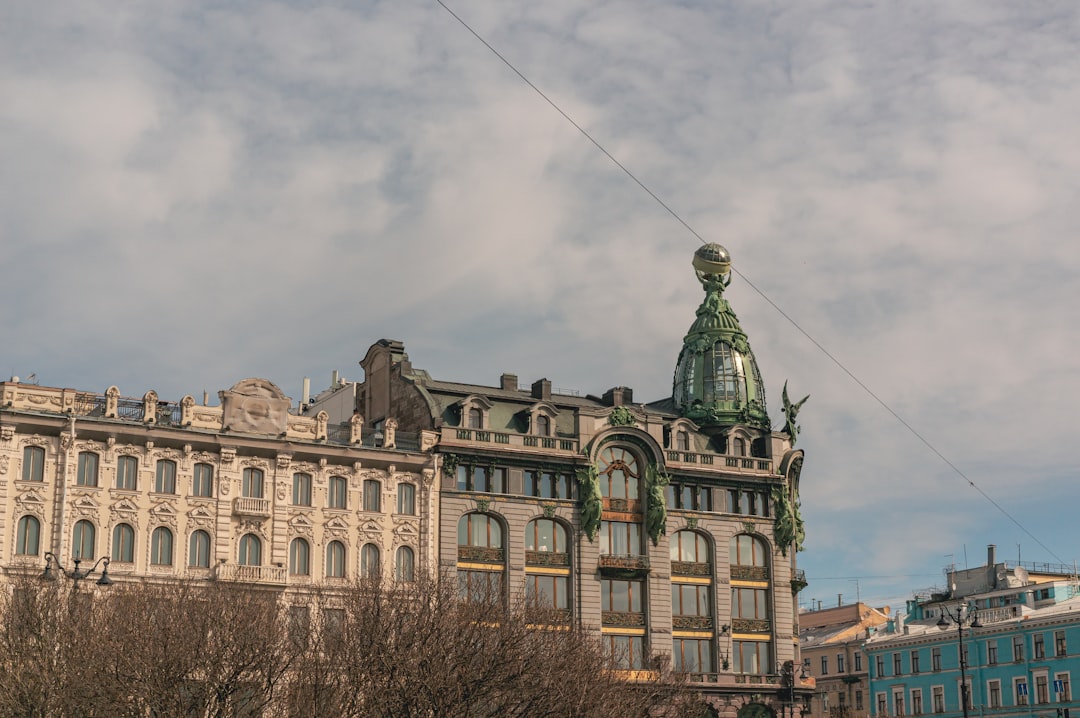
Begin at the Admiralty building where Nevsky Prospekt originates. Walk northeast along Nevsky's southern side toward the Moyka River crossing. Within 600 meters, you encounter the Stroganov Palace (1753-1754, Rastrelli's Baroque), the Lutheran Church of St. Peter (1833-1838, Neoclassical), and the Singer House (1902-1904, Style Moderne with its distinctive glass globe). The Singer House, now housing a bookstore, features a steel-frame construction that was revolutionary for Saint Petersburg. Its facade combines granite, bronze, and glass in proportions that challenged the city's height restrictions of that era.
Cross the Anichkov Bridge at the Fontanka River to examine its famous horse-taming sculptures by Pyotr Klodt (1841-1850). Turn left along the Fontanka embankment heading northwest. The Sheremetyev Palace (Fountain House) appears at number 34, showcasing 1750s Baroque with later Neoclassical modifications. The building now houses the Museum of Music, open 12:00-20:00 Wednesday through Sunday, admission 300 rubles (€3). When I visited in May 2024, the courtyard garden provided an unexpected quiet space despite being 400 meters from Nevsky Prospekt.
Continue to the Mikhailovsky Castle (1797-1801), Paul I's fortress-residence combining Neoclassical and Romantic elements. Its unusual octagonal moat and drawbridges reflect Paul's paranoia about assassination. Turn southwest along the Moyka River embankment toward the Field of Mars. This section passes the Marble Palace (1768-1785) faced with 32 types of Russian marble, and the Summer Garden's ornate railings (1771-1784) designed by Yury Felten with gilded rosettes and granite posts.
What are the key differences between Nevsky Prospekt's northern and southern sides?
Nevsky Prospekt's northern (sunny) side developed earlier and contains more Baroque and early Neoclassical buildings, while the southern (shady) side features later 19th-century construction with taller buildings and Style Moderne elements. This difference stems from property values and the city's expansion patterns after 1830.
The northern side between Admiralteyskaya and Gostiny Dvor metro stations preserves lower building heights, typically 3-4 stories with mansard roofs. The Stroganov Palace, Dutch Church, and Armenian Church cluster here, all predating 1780. These buildings maintain human-scale proportions and individual architectural expression. The Saint Petersburg Committee for State Preservation of Historical and Cultural Monuments enforces stricter renovation requirements on this side due to its earlier historical designation.
The southern side accommodated larger commercial buildings after 1850. The Passazh shopping arcade (1846-1848) introduced covered retail spaces with glass-and-iron roofing. The Eliseev Emporium (1902-1903) by Gavriil Baranovsky exemplifies Style Moderne with its curved windows, stained glass, and sculptural details. The building's interior features chandeliers, mirrors, and a palm-decorated ceiling that I found surprisingly intact during a February 2024 visit. The ground-floor delicatessen still operates, selling caviar and chocolates at premium prices (expect €30-50 for quality items).
Building heights also differ markedly. Northern side structures rarely exceed 18 meters, while southern buildings reach 24-27 meters, particularly those constructed 1880-1910. This creates an asymmetrical canyon effect when walking eastward, with afternoon shadows falling across the southern sidewalk. For photography, the northern side receives better light 14:00-17:00 during spring and summer months.
Which lesser-known architectural gems reward dedicated visitors?
Beyond the major landmarks, Saint Petersburg contains dozens of overlooked architectural treasures. The Benois Wing of the Russian Museum (1910-1912), the New Holland arch (1765-1780s), the Rossi Pavilion in the Mikhailovsky Garden (1825), and the Yelagin Palace (1818-1822) offer exceptional design without tourist crowds. These buildings demonstrate architectural innovation and craftsmanship equal to famous counterparts.
The New Holland complex on Moyka River island remained closed to the public until 2016. Its monumental arch by Jean-Baptiste Vallin de la Mothe uses rusticated granite blocks in a perfect semicircle spanning 28 meters. The surrounding warehouses employed brick vaulting techniques that eliminated wooden supports, reducing fire risk in naval stores. The complex now functions as a cultural space with free admission to courtyards and occasional exhibitions. We tasted local craft beer at the summer terrace in July 2023, enjoying the restored brick textures and modern insertions that respect the original industrial character.
The Rossi Pavilion demonstrates Carlo Rossi's mastery of garden architecture. This small structure uses just eight Corinthian columns to create an elegant shelter overlooking the Mikhailovsky Garden pond. The proportions follow strict mathematical ratios that Rossi applied across his Saint Petersburg projects. Access requires a Russian Museum ticket (450 rubles/€4.50), but the garden provides a peaceful alternative to the crowded State Russian Museum galleries next door.
Yelagin Palace on Yelagin Island showcases Rossi's residential work. The building's oval hall features trompe-l'oeil paintings that extend the architecture illusionistically. The palace museums open 10:00-18:00 Wednesday through Sunday, admission 400 rubles (€4). Reaching the island requires a 15-minute walk from Staraya Derevnya metro station (purple line), which discourages casual tourists. During my April 2024 visit, I encountered fewer than 20 other visitors despite ideal spring weather.
How do construction materials reflect Saint Petersburg's architectural evolution?
Saint Petersburg's architecture evolved through changing material availability and technology. Early buildings used imported stone and local timber, mid-period construction introduced Russian granite and marble, while late Imperial projects employed iron, steel, and reinforced concrete. These material shifts enabled new structural possibilities and aesthetic expressions.
Peter the Great initially banned stone construction outside Saint Petersburg to concentrate skilled masons in the new capital. Early buildings like the Peter and Paul Cathedral (1712-1733) combined brick walls with limestone details imported from Sweden and Germany. The cathedral's 122.5-meter gilded spire used wooden framing until 1858, when lightning damage prompted reconstruction in metal. The current spire weighs 60 tons and contains 8 kilograms of gold leaf, replaced every 25-30 years according to restoration schedules.
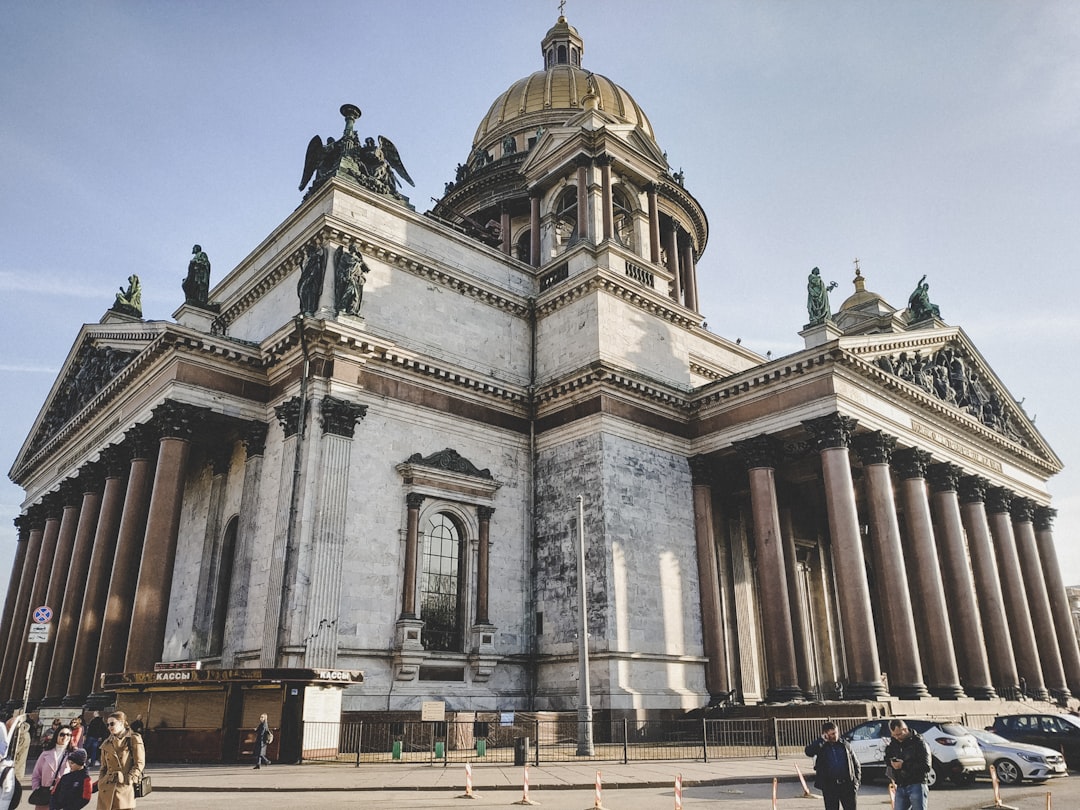
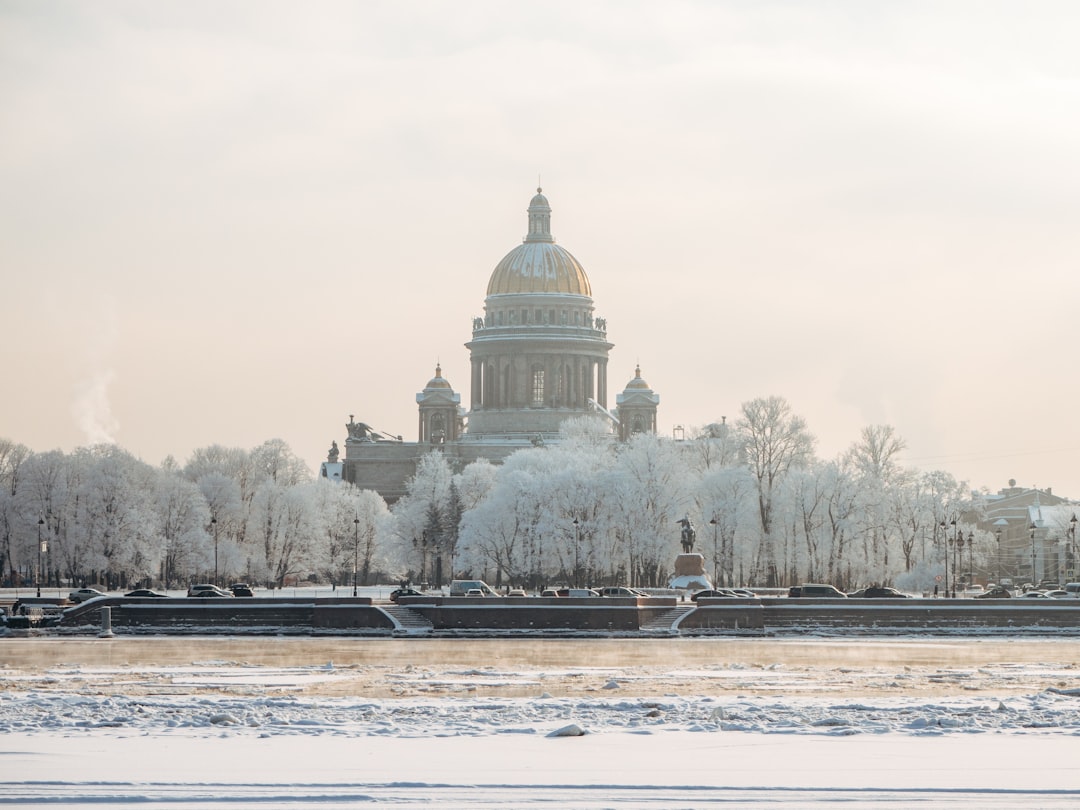
The Neoclassical period exploited newly accessible Russian quarries. The Alexander Column (1830-1834) on Palace Square uses a single 600-ton granite monolith from Virolahti, Finland, transported by specially constructed barge. St. Isaac's Cathedral (1818-1858) consumed 43 types of stone including malachite, lapis lazuli, and porphyry columns. The cathedral's 21.8-meter red granite columns, each weighing 114 tons, required innovative lifting equipment designed by Auguste de Montferrand. I observed during a September 2023 visit that the polished granite surfaces still show tool marks from 19th-century cutting techniques.
Style Moderne introduced industrial materials. The Singer House (1902-1904) employed American steel framing allowing larger windows and open interior spaces. The building's granite facing attaches to the steel skeleton rather than providing structural support. This technique, standard in Chicago and New York, was revolutionary for Saint Petersburg's traditional masonry construction. The Eliseyev Emporium used plate glass in sizes previously impossible, creating 4-meter-high display windows that transformed retail architecture.
What practical considerations affect architectural tourism in Saint Petersburg?
Architectural tourism in Saint Petersburg requires planning around weather, opening hours, and access restrictions. The city's northern latitude creates dramatic seasonal light variations affecting photography and visibility. Many historic interiors close Mondays and one additional weekday, requiring schedule coordination for multi-building visits.
Winter visits (November-March) offer 6-7 hours of daylight, with sunrise around 09:00-10:00 and sunset 15:00-16:00 in December. The low sun angle creates dramatic shadows on building facades but limits photography windows. Temperatures average -5°C to -10°C, requiring warm clothing for extended outdoor walking. However, winter provides access advantages: major sites like the Hermitage and Russian Museum have 40-50% fewer visitors compared to summer peaks. I found during a December 2023 visit that arriving at the Hermitage at 10:30 opening allowed nearly private viewing of the Jordan Staircase.
Summer's white nights (late May-mid July) reverse these conditions. Sunset occurs after 22:00, providing extended photography opportunities but creating harsh midday shadows 12:00-15:00. Tourist numbers increase 300-400% according to city statistics, with the Hermitage receiving 20,000+ daily visitors in July versus 6,000-8,000 in February. Booking advance tickets becomes necessary for popular sites. The Piter Pass offers skip-the-line access to 8 architectural landmarks including St. Isaac's Cathedral, Church of the Savior on Spilled Blood, and Peterhof, saving 2-3 hours of queue time during peak season.
Access restrictions affect several buildings. The Mariinsky Theatre (1859-1860) interior tours require advance booking through the theatre website, costing 600 rubles (€6) for 45-minute guided sessions. The Yusupov Palace on the Moyka River offers architectural tours separate from the Rasputin murder exhibition, providing better access to the White-Columned Hall and Moorish Drawing Room. Photography permissions vary: the Hermitage allows non-flash photography free, while St. Isaac's Cathedral charges 200 rubles (€2) for camera permits.
| Building | Style/Period | Admission | Best Viewing Time |
|---|---|---|---|
| Winter Palace/Hermitage | Elizabethan Baroque (1754-1762) | 1,000₽ (€10) | 10:30-12:00 Wed-Sun |
| Kazan Cathedral | Neoclassicism (1801-1811) | Free (photo 100₽) | 11:00-12:00 daily |
| Church on Spilled Blood | Russian Revival (1883-1907) | 350₽ (€3.50) | 14:00-16:00 Thu-Mon |
| St. Isaac's Cathedral | Late Neoclassicism (1818-1858) | 400₽ (€4) | 10:00-11:30 daily |
| Singer House | Style Moderne (1902-1904) | Free (exterior/bookstore) | 15:00-17:00 daily |
| Yelagin Palace | Neoclassicism (1818-1822) | 400₽ (€4) | 12:00-15:00 Wed-Sun |